 Voyah Cloud
Batteries
Monitor the charge and health of the traction and 12 V batteries, their history and detailed HV battery readings.
Two batteries and their readings
Open Charge → Detailed report in the battery status section. Choose HV battery or 12 V battery, then 24 hours, 7 days or 30 days.
- SOC is the current charge level, as a percentage.
- SOH is battery health as reported by the vehicle. It is different from current charge.
- Traction-battery SOE estimates available energy, as a percentage.
- Voltage is the voltage of the selected battery as a whole, in volts.
A dash means a valid reading is unavailable. SOH or voltage alone cannot establish the cause of a fault.
 Long screenshot preview
The report starts with four HV ring cards: SOC, SOE, SOH and voltage; the 12 V battery has three: SOC, SOH and voltage. Percentages and volts describe different quantities. Estimated kWh on the home screen use the selected vehicle model and generation; they are not a direct SOH measurement.
Traction and 12 V history
Switch the battery and period to follow charge, SOH and voltage changes. The traction battery combines charge and available energy in one chart; the 12 V battery has a separate SOC chart.
Touch a chart to inspect a reading. Compare similar conditions: parked with parked, charging with charging. Onboard loads and charging affect 12 V battery voltage.
Gaps mean measurements are missing. They do not mean the charge fell to zero.
 Long screenshot preview
HV cells and temperatures
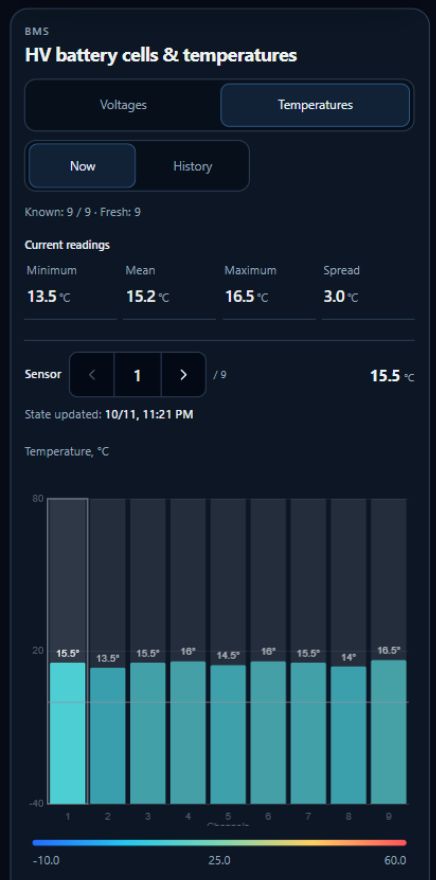
On Charge, find HV battery cells & temperatures. Choose Voltages or Temperatures, then Now or History.
The summary shows minimum, average, maximum and spread. Voltage spread is maximum minus minimum, in millivolts; temperature spread is in degrees. Select a channel number to inspect a cell or sensor. In history, select a period and measurement time.
Temperatures belong to battery sensors, not a separate measurement of every cell. A missing channel must not be treated as zero.
 Long screenshot preview
Compare at rest
Compare cell voltages with the vehicle stationary, not charging and without significant load, after readings have stabilised. Acceleration, regeneration and charging change voltages. Driving readings help observe load behaviour, but a single spread is not a diagnosis.
Reading the colour scale
A cell’s colour indicates how far its voltage is below the maximum in the same snapshot. The app’s scale is a practical guide, not Voyah factory thresholds.
| Deviation | Interpretation |
|---|---|
| Below 20 mV | Small deviation |
| 20 to below 30 mV | Monitor in comparable conditions |
| 30 to below 50 mV | Noticeable deviation; recheck at rest |
| 50 mV or more | Red zone of the scale; check whether it persists after resting |
Colour alone does not require repair. If the spread persistently exceeds 50 mV after resting, arrange a check of balancing and cell-group condition. Save images, SOC and measurement conditions. Battery faults reported by the vehicle need a separate check regardless of the app’s colours.
Temperatures use a different colour scale. Millivolt bands do not apply to it; this guide does not set factory temperature thresholds.
Why measurement conditions matter
Texas Instruments explains how load and temperature affect voltage. Orion BMS distinguishes imbalance and capacity checks using resting voltages and pack-specific settings. These sources explain the principle; they do not establish Voyah factory thresholds.